
The reality, however, is that technical analysis is not inherently complicated. The challenge lies in the way it is often presented and taught.
When most beginners encounter a trading chart for the first time, it can appear overwhelmingly complex—candlesticks scattered across the screen, seemingly random lines, and patterns that make little sense.
It is no surprise that many lose confidence before they even begin.
In this post, I’ll share a clear and practical framework to help you move from complete beginner to someone who can confidently read charts, plan trades, and avoid the common mistakes that wipe out most accounts.
Rather than relying on an overload of indicators, trend lines, or repetitive chart patterns, we will focus on four fundamental concepts:
By mastering these principles, you will move beyond the clutter of the charts and begin to recognize the underlying narrative of the market.
Prefer learning visually? Watch Jude Umeano break down the basics of technical analysis and chart reading in this YouTube video.
Want to Master Crypto & Forex Trading?
Jude Umeano, one of Nigeria’s most respected and successful traders just launched Afibie, a mentorship platform built to help you earn your first $10,000 and beyond from the markets.
Whether you’re new or stuck at break-even, this is your next step.👉 Visit Afibie now.
Understanding Market Structure
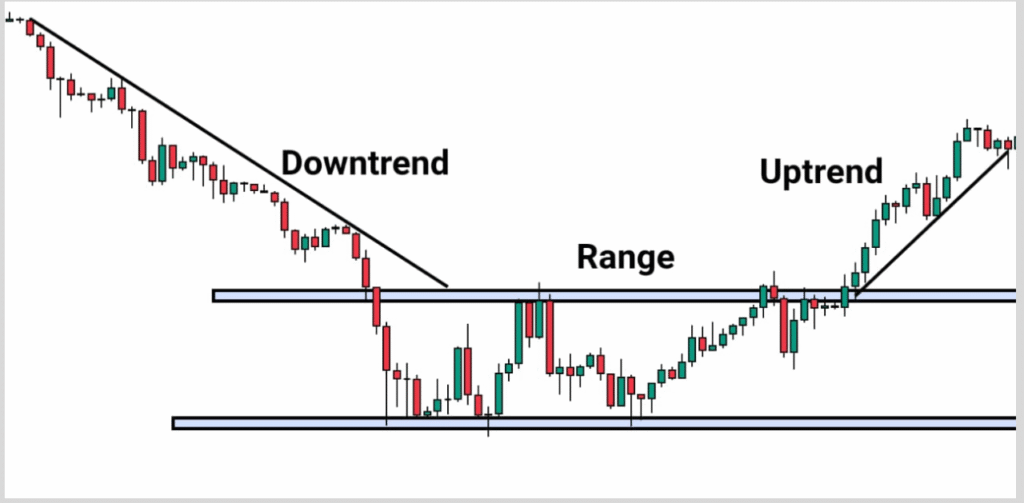
Before you enter any trade, you must first know what the market is doing. Think of the market like a story—it’s either going up, going down, or moving sideways.
- Uptrend: Price makes higher highs and higher lows
- Downtrend: Price makes lower highs and lower lows
- Consolidation: Price moves back and forth without breaking new highs or lows
The two key events you need to watch out for are:
- Break of Structure (BOS): Happens when a candle closes above the last high in an uptrend or below the last low in a downtrend. This confirms the trend is likely to continue
- Liquidity Sweep: Happens when price pushes past a high or low with just a wick (not a candle body). This usually traps traders before reversing in the opposite direction
In simple terms, BOS shows strength, liquidity sweep shows manipulation. Learn this, and you’ll stop guessing trades.
Supply And Demand Zones
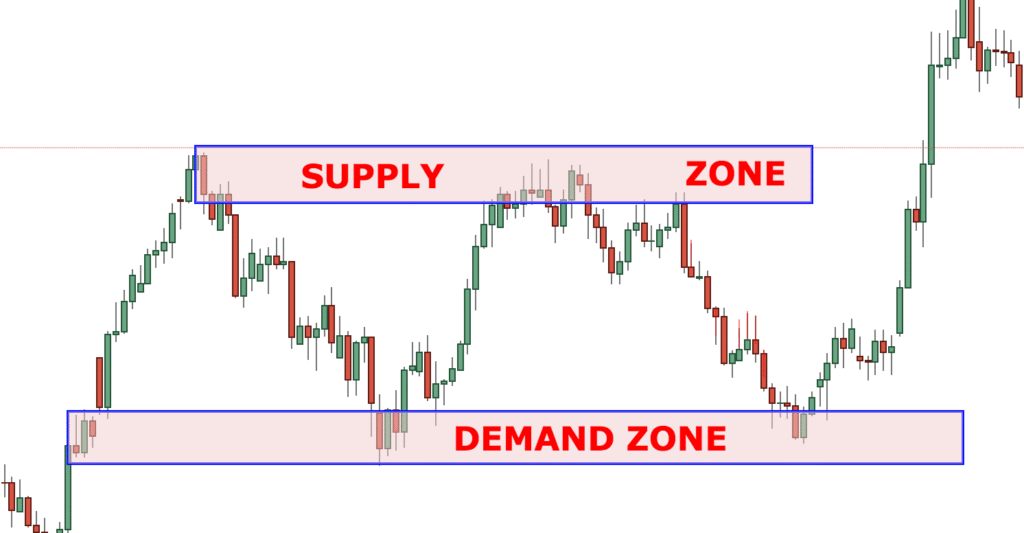
The next building block is understanding supply and demand zones—these are the areas where big money moves the market.
- Supply Zone: Where sellers are waiting. When price hits this zone, it often drops lower
- Demand Zone: Where buyers are waiting. When price hits this zone, it often goes higher
How do you find these zones? Look for the order block—the last candle before a strong move that breaks structure.
But here’s something to note: a valid supply or demand zone must also have an imbalance (fair value gap).
Imbalance (Fair Value Gap)
An imbalance happens when price moves so fast that it skips levels, leaving a “gap” on the chart. This gap is often filled later before price continues in its original direction.
For a high-probability setup, you want two things together:
- An order block (supply/demand zone)
- An imbalance (gap)
When price returns to that zone to fill the gap, that’s usually where the best trades happen—especially when it aligns with your market structure and liquidity setup.
Liquidity: The Magnet of Price
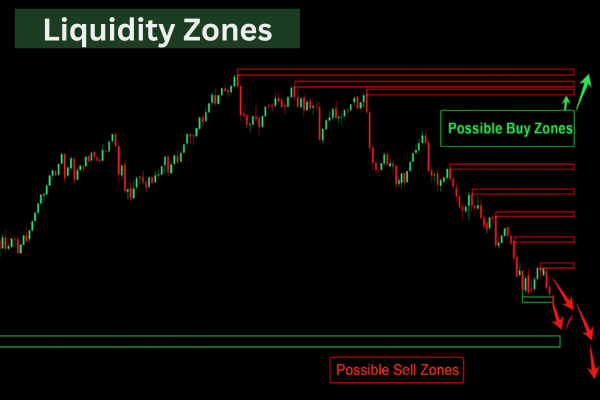
Liquidity is simply where orders are sitting in the market—stop-losses, pending orders, etc. Price is naturally drawn to these levels.
The most common liquidity traps are:
- Equal highs/lows: Traders place stop-losses just above or below them
- Support and resistance levels: Where retail traders love to enter and place stops
Smart money often pushes price past these levels to grab liquidity before reversing. That’s why you must always ask: did this move break structure or just sweep liquidity?
Liquidity also helps you decide where to take profit. If you see liquidity pools above supply or below demand, that’s often a strong target area.
Again, liquidity not only reveals where price is likely headed but also helps you define your targets.
For example, if you spot liquidity pools above a supply zone or below a demand zone, those areas often act like magnets, pulling price toward them.
Once liquidity has been swept or absorbed, the next critical question becomes how to actually get into the trade. This is where trade entry models come into play.
Trade Entry Models: How to Time and Structure Your Entries
After identifying the market direction (via structure), locating your zones (supply/demand and imbalances), and pinpointing liquidity targets, the final step is execution.
How you enter a trade is just as important as where and why you enter it. Traders typically rely on three core entry models, each with its own trade-off between speed, risk, and reliability:
(i) Risk Entry (Aggressive Entry)
With this model, you enter a trade as soon as price taps into your supply or demand zone without waiting for confirmation.
The advantage of this method is that it allows you to capture the best possible price and maximize your risk-to-reward potential.
However, the downside is that it carries a higher chance of being stopped out if the zone fails.
(ii) Confirmation Entry (Conservative Entry)
Here, you wait for price action to confirm that the zone is valid before entering, which could come in the form of a smaller timeframe break of structure, a rejection candle, or a clear shift in momentum.
This strategy helps increase your win rate by filtering out false moves, though the trade-off is that you often miss the absolute best entry price and may have to settle for a later entry with a smaller reward.
For instance, when price taps a demand zone and then shows a break of structure on the 1-minute chart, that’s your signal to go long.
(iii) Momentum Entry (Continuation Entry)
Instead of waiting for a reversal at supply or demand, this strategy lets you join the move once momentum has already shifted in your favor—essentially entering with the trend.
It works best in trending markets because you’re trading with the flow, though the trade-off is that the risk-to-reward ratio is usually smaller since the move is already underway.
For example, when price breaks strongly through a supply zone, you wait for a minor pullback and then enter in the same direction as the breakout.
Alongside these entry models, some traders use indicators such as stochastic RSI, MACD, or moving averages for confirmation.
These tools can add confluence, but they should complement not replace your core framework of structure, supply/demand, and liquidity.
Conclusion
Technical analysis doesn’t need to be a jungle of indicators and confusing patterns.
With the right roadmap; market structure, supply & demand, liquidity, and imbalance, you can see the market clearly and trade with confidence.
The truth is, once you master these concepts, you’ll realize why most traders lose—they are playing a blurry game while you are reading the market like an open book.
So the next time you open a chart, don’t be overwhelmed. Follow the story. Spot the zones. Watch the liquidity. And take your trades with structure, not guesswork.
If you had to master just one concept first, which would it be? Share your thoughts in the comments —we’d love to hear from you.

")

0 Comments